Gold · Gold Education
Gold and Federal Reserve Policy: How Interest Rates Drive the Price of Gold
Executive Summary
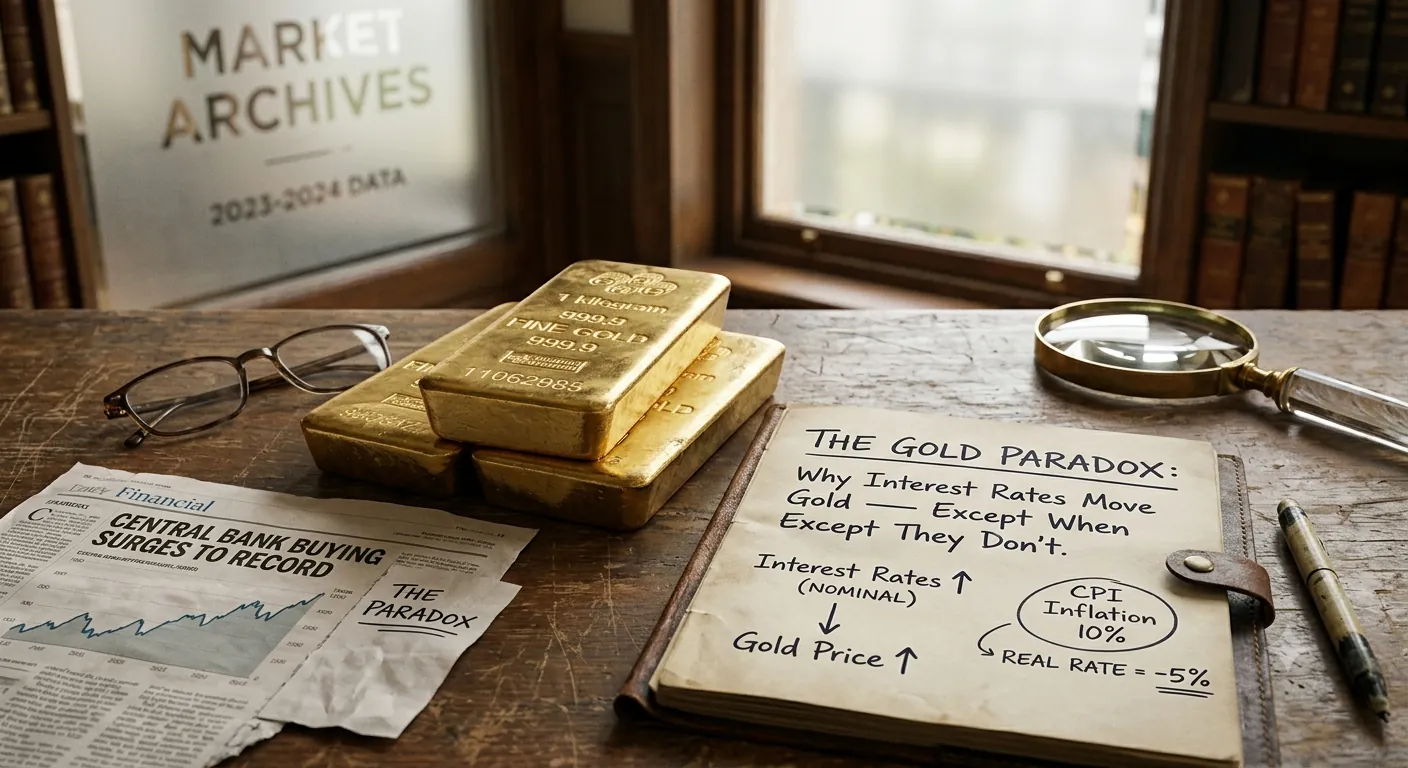
Gold pays no yield, so its price is highly sensitive to the opportunity cost of holding it — a cost set mainly by real, inflation-adjusted interest rates rather than nominal rates. This guide explains the three channels through which Federal Reserve policy reaches gold prices — real yields, the U.S. dollar, and system liquidity — and shows, through two contrasting historical episodes, why interest rates alone no longer fully explain gold's price since 2022.
Key Takeaways
Gold's price is driven mainly by real interest rates, not nominal rates, because gold earns no yield.
Fed policy reaches gold through three channels: real Treasury yields, the U.S. dollar, and system liquidity.
Historically, gold falls when real yields rise sharply and rises when real yields fall — the 2013 "taper tantrum" is the textbook case.
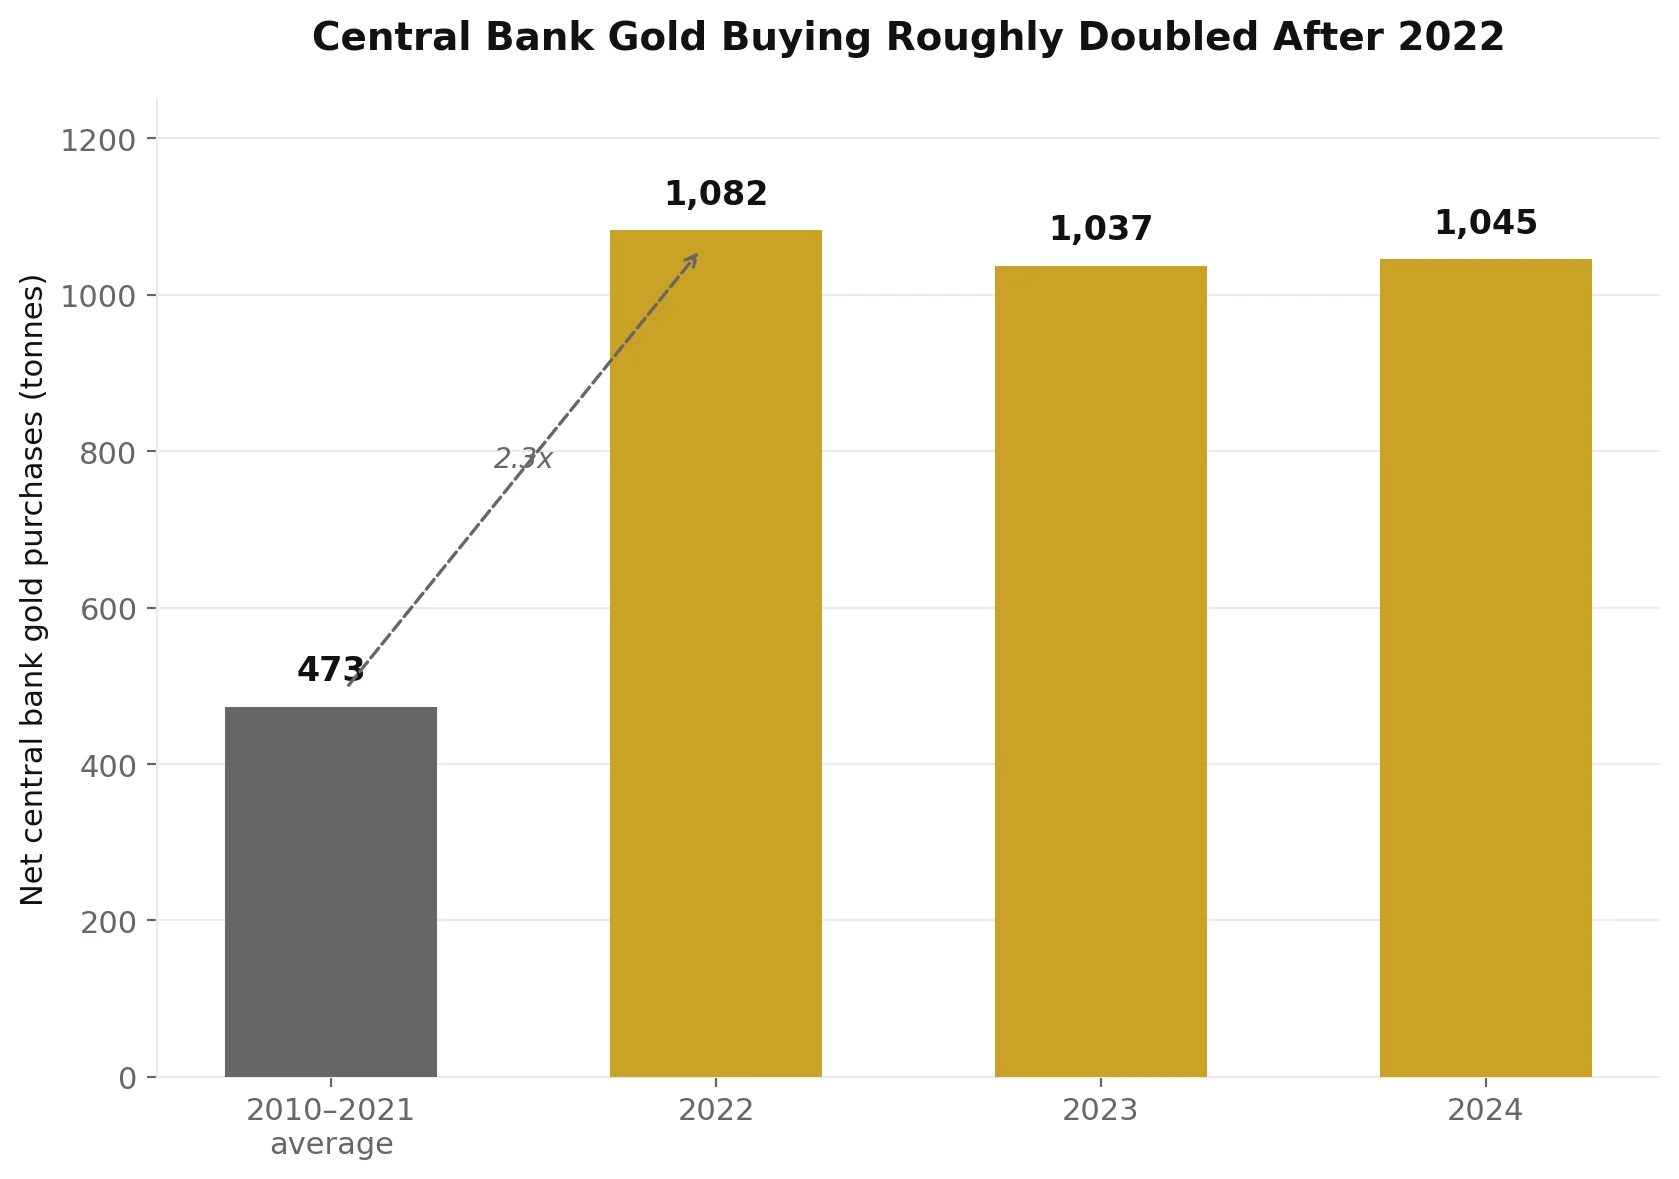
Since 2022, record central bank gold buying has partly broken this relationship, keeping gold strong even as real yields rose.
Why a Non-Yielding Asset Reacts to Interest Rates
Holding gold means giving up the income available from interest-bearing alternatives such as Treasury bonds. That forgone income is gold's opportunity cost, and it is best measured by the real interest rate — the nominal rate minus expected inflation — not the nominal rate alone.
When real rates are low or negative, holding gold costs little, because bonds aren't offering a meaningful inflation-adjusted return either. When real rates rise, gold becomes comparatively less attractive. This is why institutional gold analysis — from the World Gold Council, CME Group, and Federal Reserve staff research — centers on the 10-year TIPS yield as the key explanatory variable, not the federal funds rate in isolation.
Three Channels From Fed Policy to Gold
Real yields (the primary channel). The Fed sets short-term rates directly and influences long-term Treasury yields through guidance and balance-sheet policy. Falling real yields have historically pushed capital toward gold; rising real yields have pulled it away.
The U.S. dollar. Gold is priced globally in dollars. A weaker dollar makes gold cheaper for non-U.S. buyers, supporting demand; a stronger dollar has the opposite effect. Fed policy is a major driver of the dollar's relative strength.
System liquidity. Quantitative easing expands liquidity and suppresses yields, historically supportive for gold (2008–2012, 2020). Quantitative tightening does the reverse.
Real-World Example: Two Fed Cycles, Two Outcomes
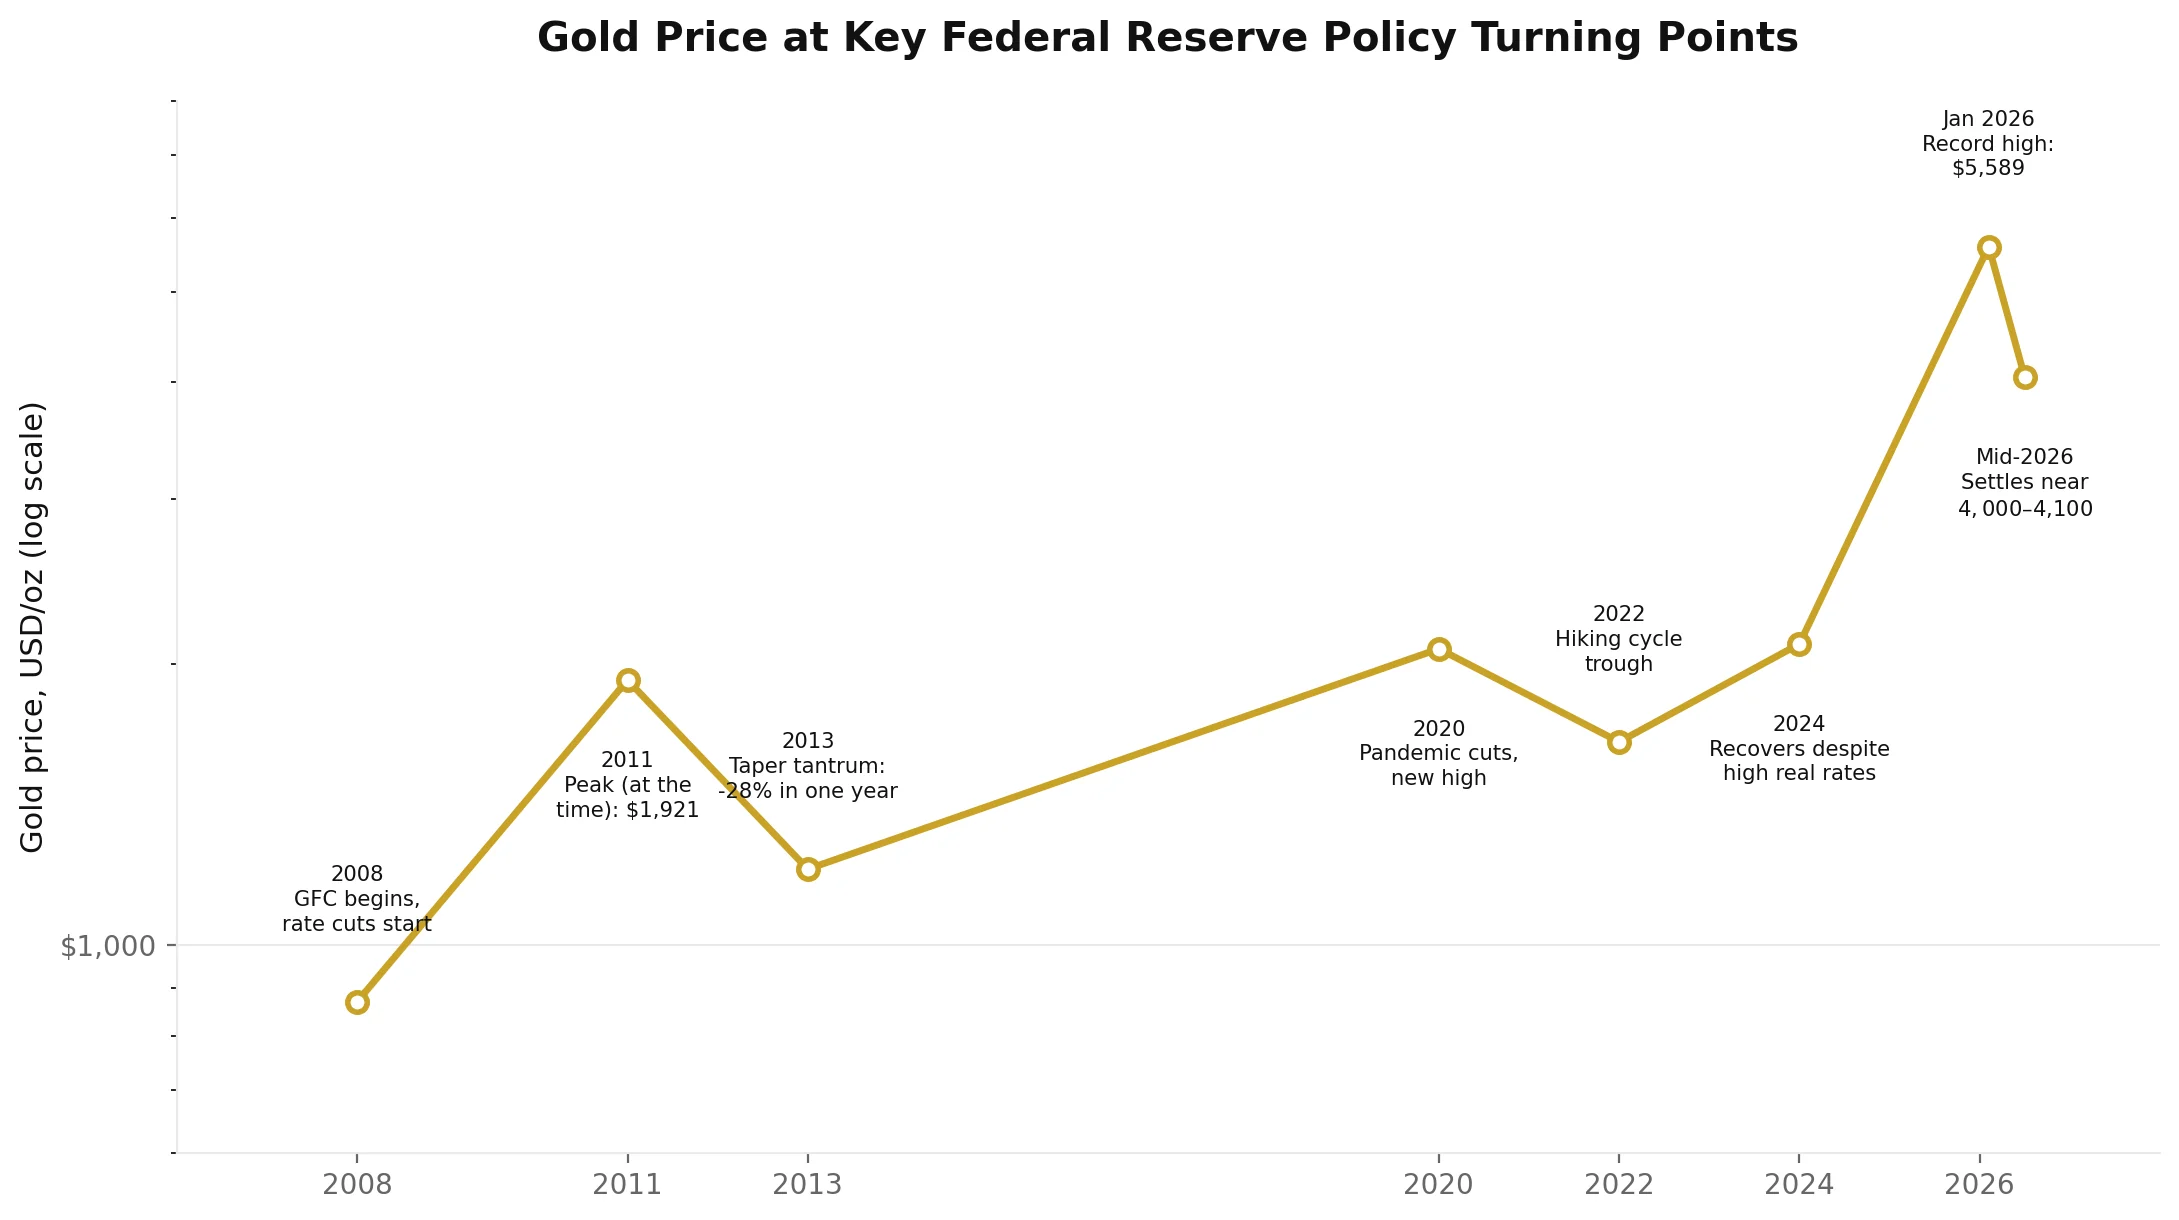
2013 — the textbook case. When Fed Chair Bernanke signaled in May 2013 that asset purchases could soon slow, the 10-year Treasury yield jumped from roughly 2% to 3% within seven months, and the dollar strengthened. With inflation expectations stable, this was primarily a rise in real yields. Gold fell from about $1,695/oz to $1,205.55/oz by year-end — a 28% drop, its worst year in three decades. This is the clean, expected result: rising real yields, falling gold.
2022–2024 — the breakdown. The Fed raised rates from near zero to 5.25–5.50% in its fastest hiking cycle since the 1980s, and real yields rose sharply. Under the pre-2022 pattern, gold should have fallen hard and stayed down. It initially dropped to about $1,650/oz in late 2022 — then recovered to new highs near $2,100/oz by early 2024, despite real yields remaining elevated.
The difference was demand outside the rate cycle: central banks bought roughly 1,082 tonnes of gold in 2022 (the most since 1950), 1,037 tonnes in 2023, and about 1,045 tonnes in 2024 — more than double the 2010–2021 average of roughly 473 tonnes a year, per World Gold Council data. Much of this came from emerging-market central banks diversifying reserves after Russia's dollar and euro reserves were frozen in 2022, plus broader geopolitical and inflation concerns. That buying created a demand floor independent of yields — and by January 2026, with the Fed cutting rates again, gold reached a record near $5,589/oz before settling around $4,000–$4,100/oz by mid-2026.
The lesson: the same policy tool — rising real yields — produced opposite outcomes in 2013 and 2022–2024, because a large, price-insensitive buyer changed the equation. Real yields remain necessary to the analysis, but are no longer sufficient alone.
Hover or tap a bar for details
Gold’s price change during each of the last seven major Federal Reserve rate-hiking cycles, 1983–2023. All cycles shown were periods of rising interest rates — note that gold’s reaction varied enormously, from a 29% decline to an 88% gain, underscoring that rate direction alone does not determine gold’s response.
Frequently Asked Questions
Does the Fed set the price of gold? No. It influences gold indirectly, through real yields, the dollar, and liquidity conditions — not by targeting gold directly.
Why do real yields matter more than nominal rates? Gold earns no interest, so its true cost of holding is the inflation-adjusted return available elsewhere. A high nominal rate with even higher inflation is still a negative real rate — historically supportive for gold.
Why did gold rise in 2023–2024 despite high rates? Central banks bought over 1,000 tonnes a year, for reserve diversification and geopolitical reasons unrelated to yield — demand that offset the usual drag from high real rates.
Does a Fed rate cut always mean gold rises? Not automatically — it depends on why the Fed is cutting. Growth-driven cuts without inflation risk can play out differently than cuts made amid financial stress or renewed inflation.
Where can I check this data myself? FRED (fred.stlouisfed.org) has real yields (DFII10) and the fed funds rate (FEDFUNDS) free to download. The World Gold Council (gold.org/goldhub) publishes quarterly central bank purchase data.
Key Conclusions
Gold's price reflects the opportunity cost of holding a non-yielding asset — best measured by real, not nominal, interest rates.
Fed policy reaches gold through real yields, the dollar, and system liquidity, not the policy rate alone.
2013 shows the classical relationship: rising real yields, falling gold.
2022–2024 shows it can break down when a large, price-insensitive buyer — central banks — enters for non-yield reasons.
Central bank buying has more than doubled its historical pace since 2022, mainly on reserve diversification.
A complete gold framework today combines rate analysis with central bank reserve-flow data.
Sources
- Federal Reserve — FOMC record; FRED series FEDFUNDS (federal funds rate) and DFII10 (10-year TIPS real yield)
- LBMA — gold price history
- World Gold Council — Gold Demand Trends and Central Bank Gold Reserves Survey
- CME Group — gold market research
This article is provided for informational purposes only and does not constitute investment, financial, or trading advice.